Rainbow Colormaps Are Not All Bad
Colin Ware -
Maureen Stone -
Danielle Albers Szafir -
Access paper PDF
DOI: 10.1109/MCG.2023.3246111
Room: Bayshore III
2024-10-17T16:12:00ZGMT-0600Change your timezone on the schedule page
2024-10-17T16:12:00Z

Fast forward
Full Video
Keywords
Image Color Analysis, Semantics, Data Visualization, Estimation, Reliability Engineering
Abstract
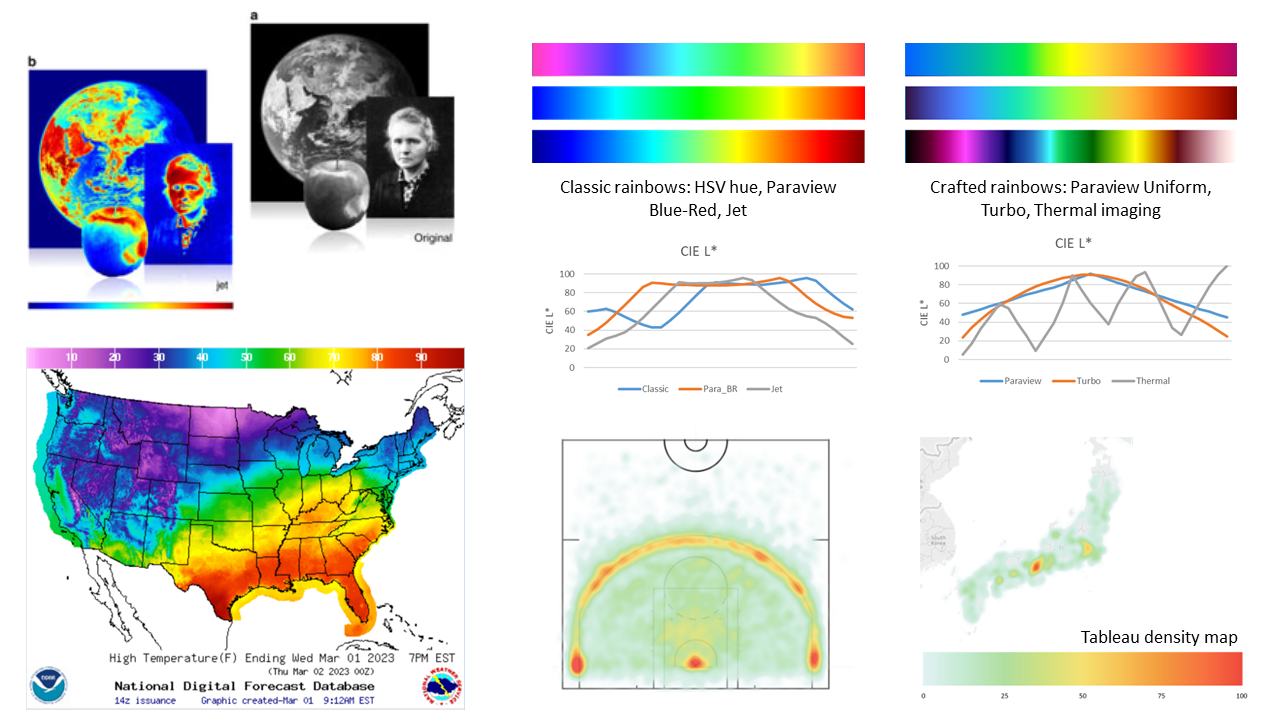
Some 15 years ago, Visualization Viewpoints published an influential article titled Rainbow Color Map (Still) Considered Harmful (Borland and Taylor, 2007). The paper argued that the “rainbow colormap’s characteristics of confusing the viewer, obscuring the data and actively misleading interpretation make it a poor choice for visualization.” Subsequent articles often repeat and extend these arguments, so much so that avoiding rainbow colormaps, along with their derivatives, has become dogma in the visualization community. Despite this loud and persistent recommendation, scientists continue to use rainbow colormaps. Have we failed to communicate our message, or do rainbow colormaps offer advantages that have not been fully appreciated? We argue that rainbow colormaps have properties that are underappreciated by existing design conventions. We explore key critiques of the rainbow in the context of recent research to understand where and how rainbows might be misunderstood. Choosing a colormap is a complex task, and rainbow colormaps can be useful for selected applications.