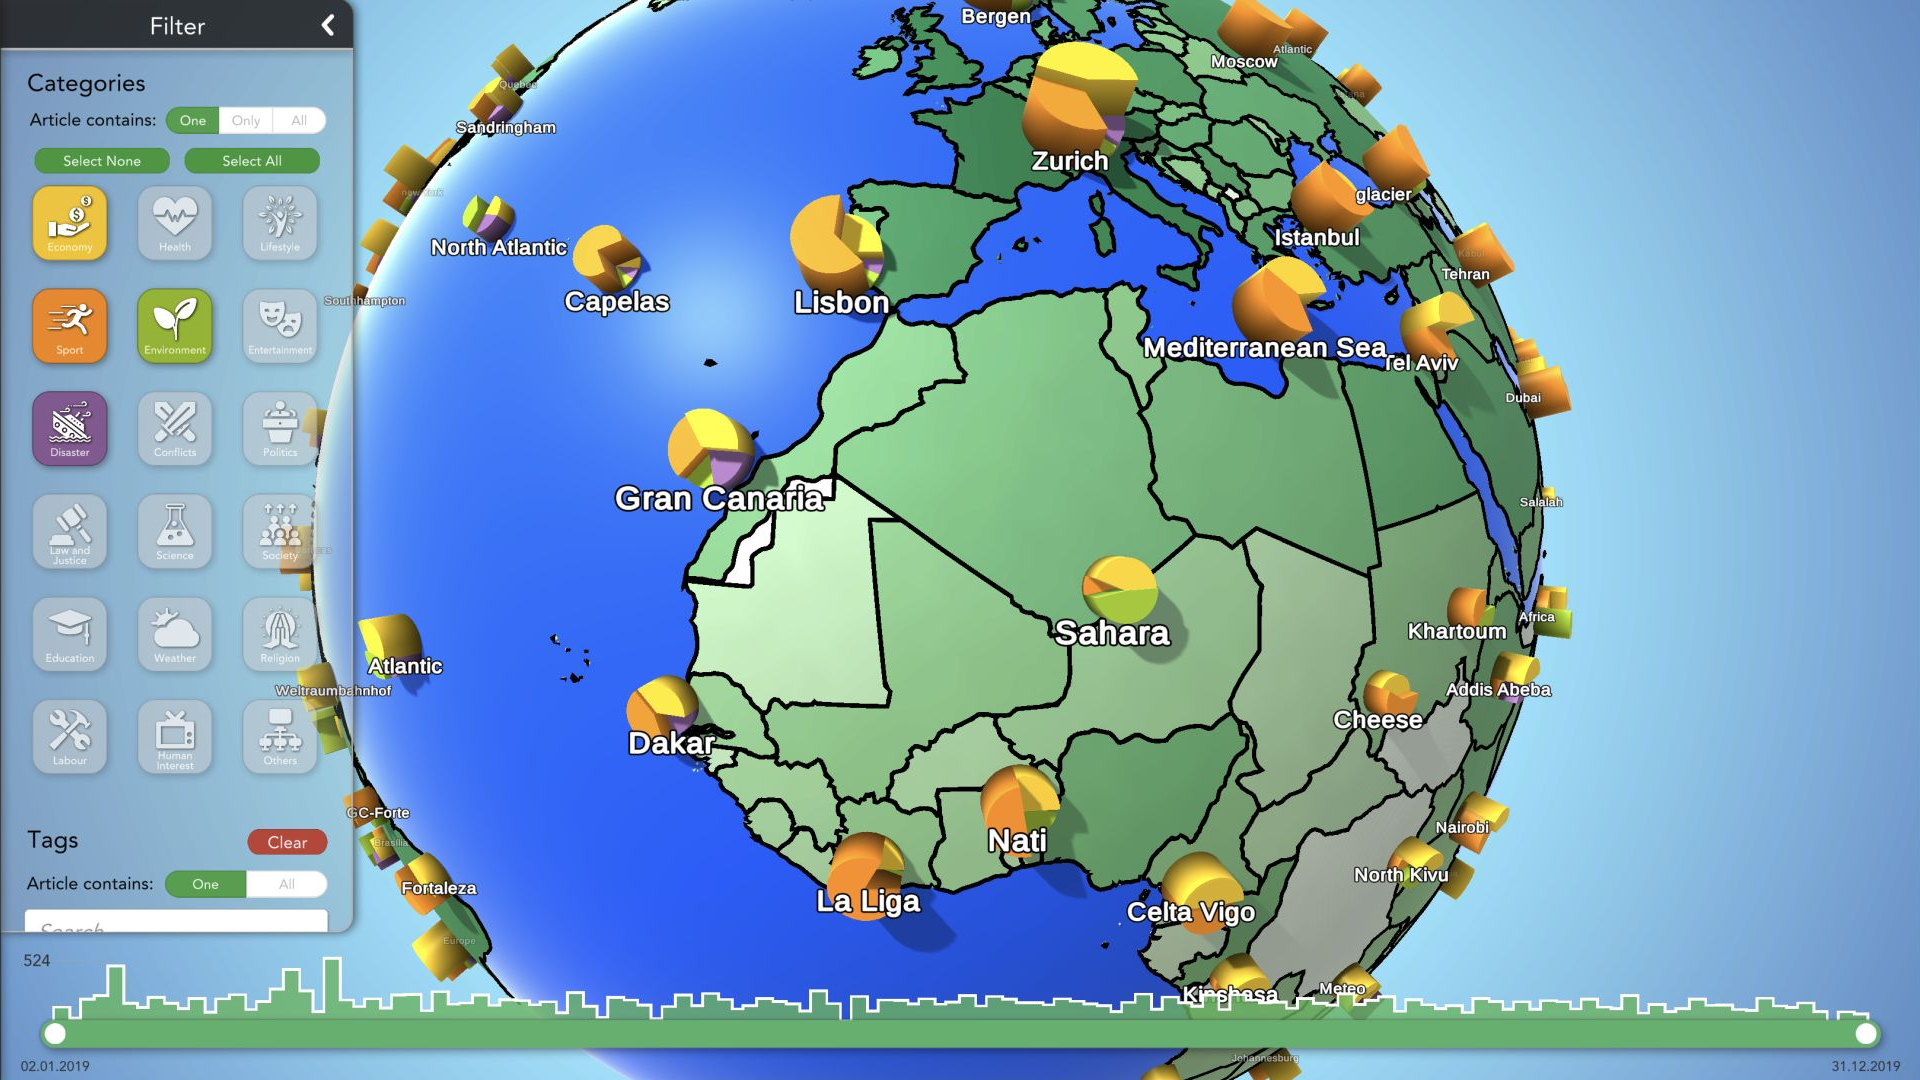
News Globe: Visualization of Geolocalized News Articles
Nicholas Ingulfsen -
Simone Schaub-Meyer -
Markus Gross -
Tobias Günther -
Access paper PDF
DOI: 10.1109/MCG.2021.3127434
Room: Bayshore III
2024-10-16T16:12:00ZGMT-0600Change your timezone on the schedule page
2024-10-16T16:12:00Z

Fast forward
Full Video
Keywords
News Articles, Number Of Articles, Headlines, Interactive Visualization, Online News, Agglomerative Clustering, Local News, Interactive Exploration, Desktop PC, Different Levels Of Detail, News Portals, Spatial Information, User Study, 3D Space, Human-computer Interaction, Temporal Information, Third Dimension, Tablet Computer, Pie Chart, News Stories, 3D Visualization, Article Details, Visual Point, Bottom Of The Screen, Geospatial Data, Type Of Visualization, Largest Dataset, Tagging Location, Live Feed
Abstract
The number of online news articles available nowadays is rapidly increasing. When exploring articles on online news portals, navigation is mostly limited to the most recent ones. The spatial context and the history of topics are not immediately accessible. To support readers in the exploration or research of articles in large datasets, we developed an interactive 3D globe visualization. We worked with datasets from multiple online news portals containing up to 45,000 articles. Using agglomerative hierarchical clustering, we represent the referenced locations of news articles on a globe with different levels of detail. We employ two interaction schemes for navigating the viewpoint on the visualization, including support for hand-held devices and desktop PCs, and provide search functionality and interactive filtering. Based on this framework, we explore additional modules for jointly exploring the spatial and temporal domain of the dataset and incorporating live news into the visualization.