Revealing Interaction Dynamics: Multi-Level Visual Exploration of User Strategies with an Interactive Digital Environment
Peilin Yu - Linköping University, Norrköping, Sweden
Aida Nordman - Linköping University, Norrköping, Sweden
Marta M. Koc-Januchta - Linköping University, Norrköping, Sweden
Konrad J Schönborn - Linköping University, Norrköping, Sweden. Linköping University, Norrköping, Sweden
Lonni Besançon - Linköping University, Norrköping, Sweden
Katerina Vrotsou - Linköping University, Norrköping, Sweden
Screen-reader Accessible PDF
Download preprint PDF
Download Supplemental Material
Room: Bayshore VI
2024-10-16T14:15:00ZGMT-0600Change your timezone on the schedule page
2024-10-16T14:15:00Z

Fast forward
Full Video
Keywords
Visual analytics, Visualization systems and tools, Interaction logs, Visualization techniques, Visual learning
Abstract
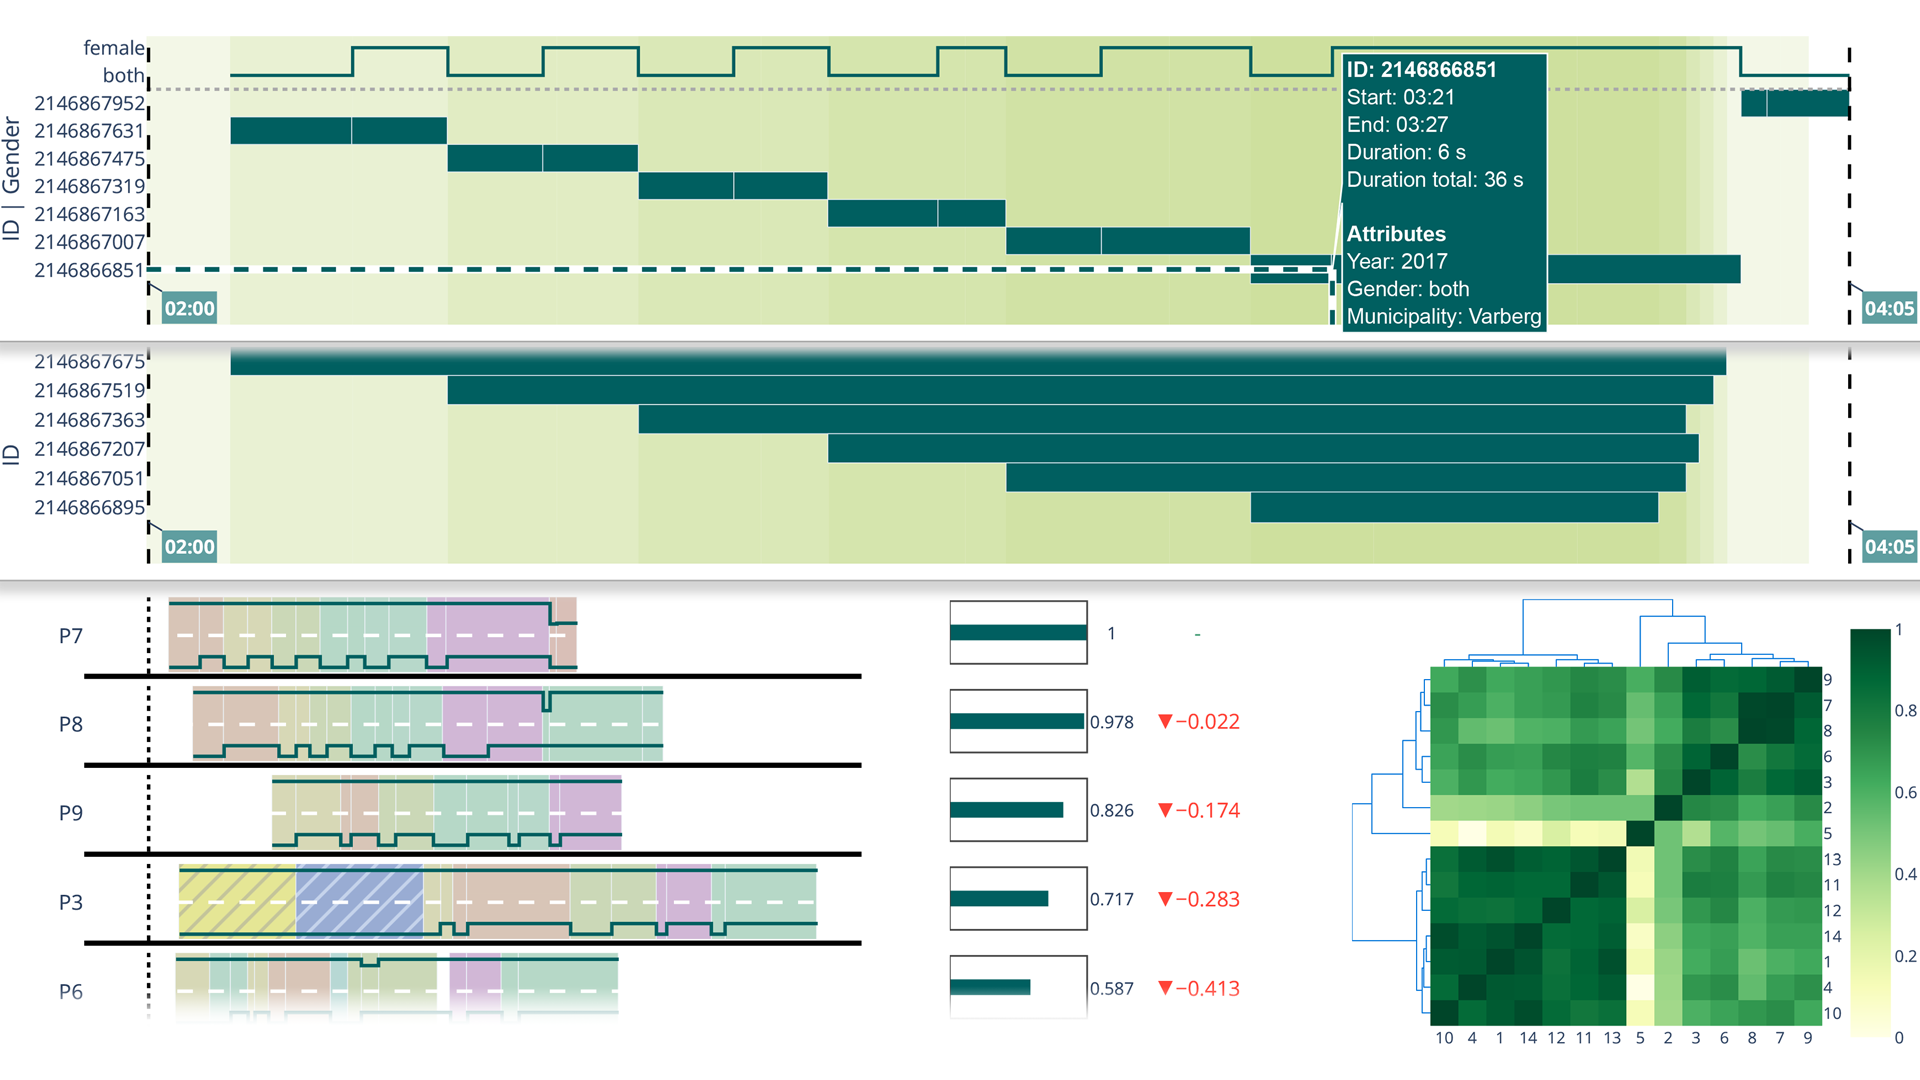
We present a visual analytics approach for multi-level visual exploration of users' interaction strategies in an interactive digital environment. The use of interactive touchscreen exhibits in informal learning environments, such as museums and science centers, often incorporate frameworks that classify learning processes, such as Bloom’s taxonomy, to achieve better user engagement and knowledge transfer. To analyze user behavior within these digital environments, interaction logs are recorded to capture diverse exploration strategies. However, analysis of such logs is challenging, especially in terms of coupling interactions and cognitive learning processes, and existing work within learning and educational contexts remains limited. To address these gaps, we develop a visual analytics approach for analyzing interaction logs that supports exploration at the individual user level and multi-user comparison. The approach utilizes algorithmic methods to identify similarities in users' interactions and reveal their exploration strategies. We motivate and illustrate our approach through an application scenario, using event sequences derived from interaction log data in an experimental study conducted with science center visitors from diverse backgrounds and demographics. The study involves 14 users completing tasks of increasing complexity, designed to stimulate different levels of cognitive learning processes. We implement our approach in an interactive visual analytics prototype system, named VISID, and together with domain experts, discover a set of task-solving exploration strategies, such as "cascading" and "nested-loop", which reflect different levels of learning processes from Bloom's taxonomy. Finally, we discuss the generalizability and scalability of the presented system and the need for further research with data acquired in the wild.