HuBar: A Visual Analytics Tool to Explore Human Behaviour based on fNIRS in AR guidance systems
Sonia Castelo Quispe - New York University, New York, United States
João Rulff - New York University, New York, United States
Parikshit Solunke - New York University, Brooklyn, United States
Erin McGowan - New York University, New York, United States
Guande Wu - New York University, New York CIty, United States
Iran Roman - New York University, Brooklyn, United States
Roque Lopez - New York University, New York, United States
Bea Steers - New York University, Brooklyn, United States
Qi Sun - New York University, New York, United States
Juan Pablo Bello - New York University, New York, United States
Bradley S Feest - Northrop Grumman Mission Systems, Redondo Beach, United States
Michael Middleton - Northrop Grumman, Aurora, United States
Ryan McKendrick - Northrop Grumman, Falls Church, United States
Claudio Silva - New York University, New York City, United States
Download preprint PDF
Download Supplemental Material
Room: Bayshore I
2024-10-17T16:24:00ZGMT-0600Change your timezone on the schedule page
2024-10-17T16:24:00Z

Fast forward
Full Video
Keywords
Perception & Cognition, Application Motivated Visualization, Temporal Data, Image and Video Data, Mobile, AR/VR/Immersive, Specialized Input/Display Hardware.
Abstract
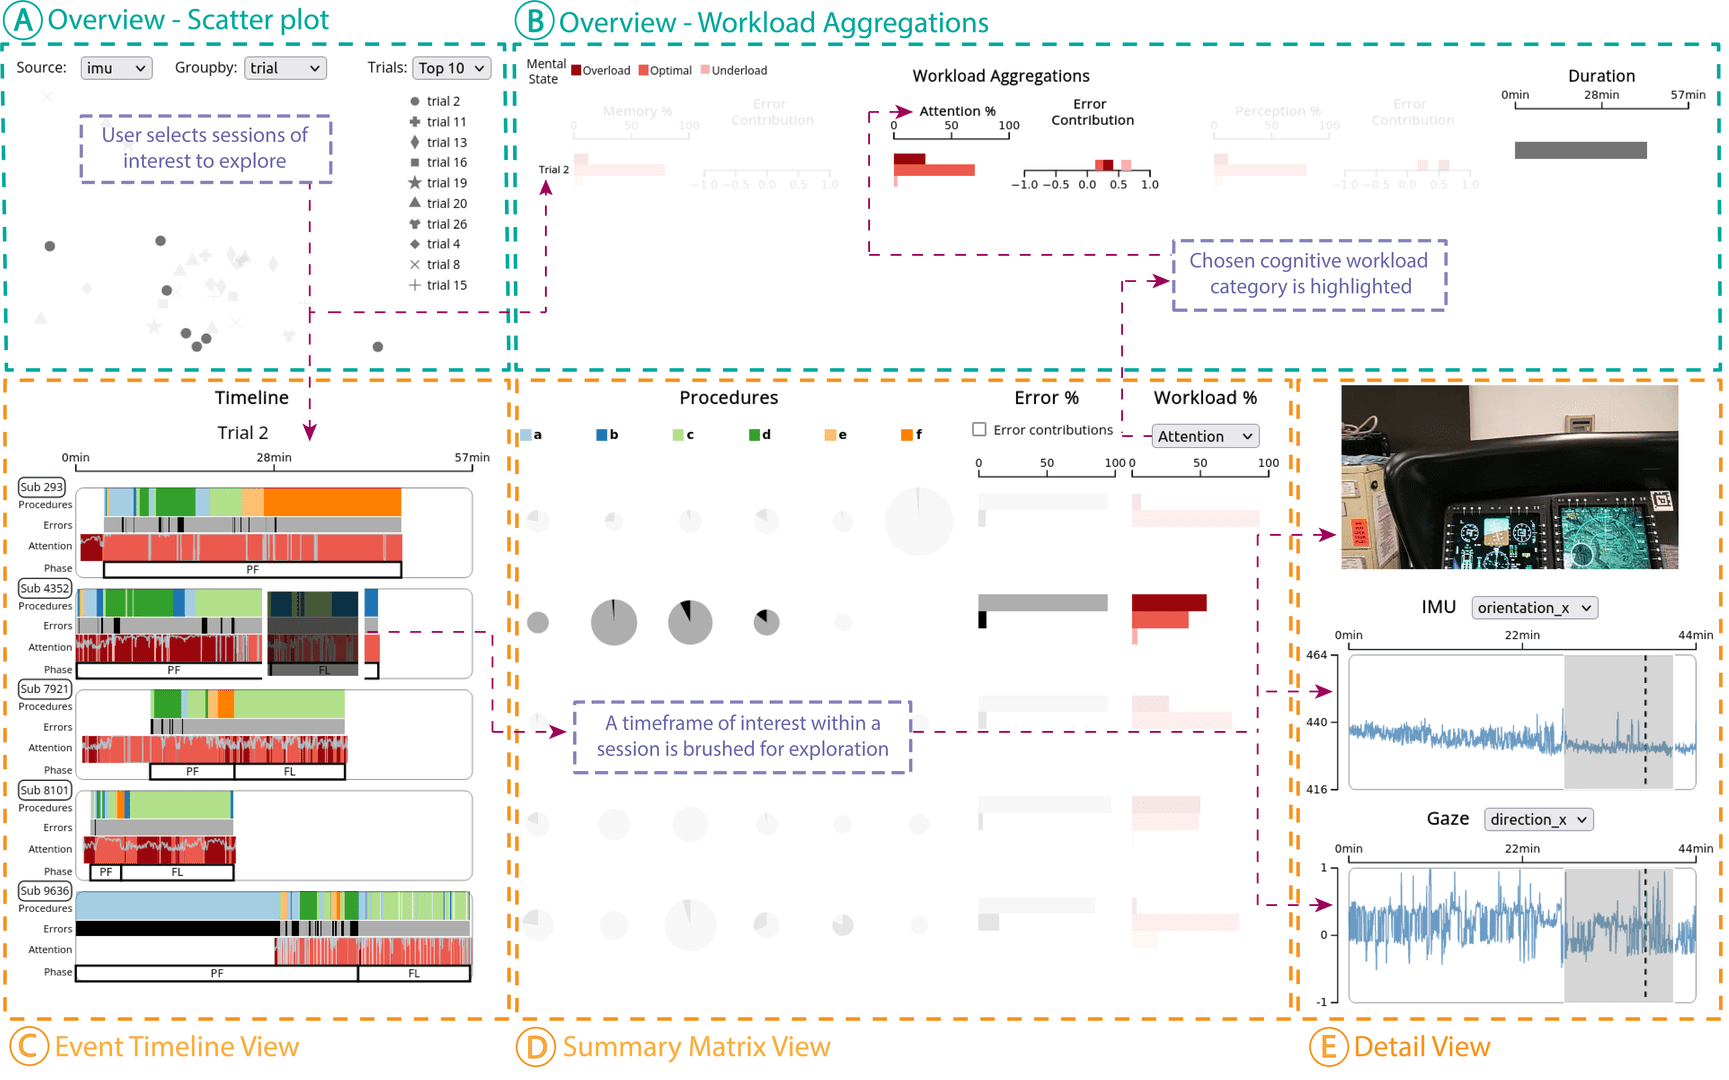
The concept of an intelligent augmented reality (AR) assistant has significant, wide-ranging applications, with potential uses in medicine, military, and mechanics domains. Such an assistant must be able to perceive the environment and actions, reason about the environment state in relation to a given task, and seamlessly interact with the task performer. These interactions typically involve an AR headset equipped with sensors which capture video, audio, and haptic feedback. Previous works have sought to facilitate the development of intelligent AR assistants by visualizing these sensor data streams in conjunction with the assistant's perception and reasoning model outputs. However, existing visual analytics systems do not focus on user modeling or include biometric data, and are only capable of visualizing a single task session for a single performer at a time. Moreover, they typically assume a task involves linear progression from one step to the next. We propose a visual analytics system that allows users to compare performance during multiple task sessions, focusing on non-linear tasks where different step sequences can lead to success. In particular, we design visualizations for understanding user behavior through functional near-infrared spectroscopy (fNIRS) data as a proxy for perception, attention, and memory as well as corresponding motion data (acceleration, angular velocity, and gaze). We distill these insights into embedding representations that allow users to easily select groups of sessions with similar behaviors. We provide two case studies that demonstrate how to use these visualizations to gain insights abouttask performance using data collected during helicopter copilot training tasks. Finally, we evaluate our approach by conducting an in-depth examination of a think-aloud experiment with five domain experts.