A Literature-based Visualization Task Taxonomy for Gantt Charts
Sayef Azad Sakin - University of Utah, Salt Lake City, United States
Katherine E. Isaacs - The University of Utah, Salt Lake City, United States
Screen-reader Accessible PDF
Download preprint PDF
Download Supplemental Material
Room: Bayshore VI
2024-10-17T13:15:00ZGMT-0600Change your timezone on the schedule page
2024-10-17T13:15:00Z

Fast forward
Full Video
Keywords
Gantt chart—Visualization—Task taxonomy
Abstract
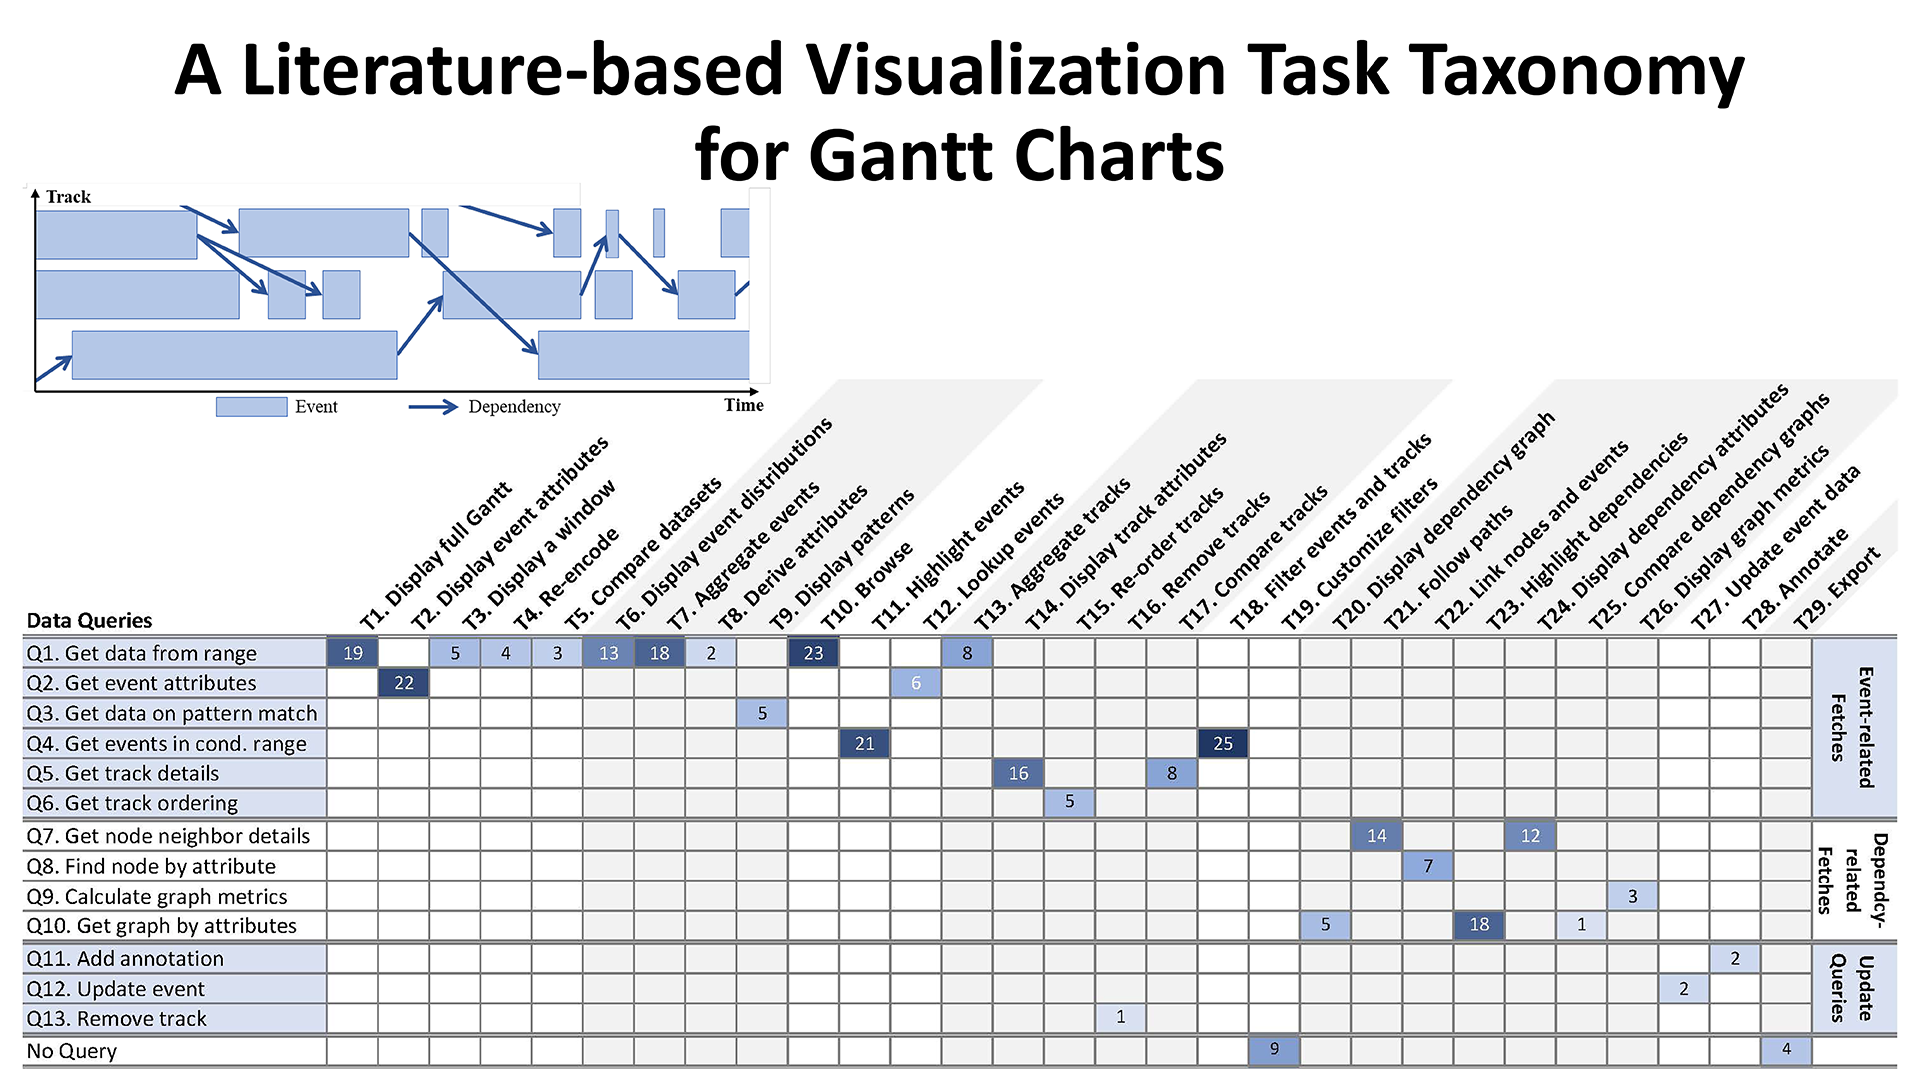
Gantt charts are a widely-used idiom for visualizing temporal discrete event sequence data where dependencies exist between events. They are popular in domains such as manufacturing and computing for their intuitive layout of such data. However, these domains frequently generate data at scales which tax both the visual representation and the ability to render it at interactive speeds. To aid visualization developers who use Gantt charts in these situations, we develop a task taxonomy of low level visualization tasks supported by Gantt charts and connect them to the data queries needed to support them. Our taxonomy is derived through a literature survey of visualizations using Gantt charts over the past 30 years.