Science in a Blink: Supporting Ensemble Perception in Scalar Fields
Victor A. Mateevitsi - Argonne National Laboratory, Lemont, United States
Michael E. Papka - Argonne National Laboratory, Lemont, United States. University of Illinois Chicago, Chicago, United States
Khairi Reda - Indiana University, Indianapolis, United States
Download preprint PDF
Download Supplemental Material
Room: Bayshore VI
2024-10-17T12:39:00ZGMT-0600Change your timezone on the schedule page
2024-10-17T12:39:00Z

Fast forward
Full Video
Keywords
Ensemble perception, colormaps, scalar fields
Abstract
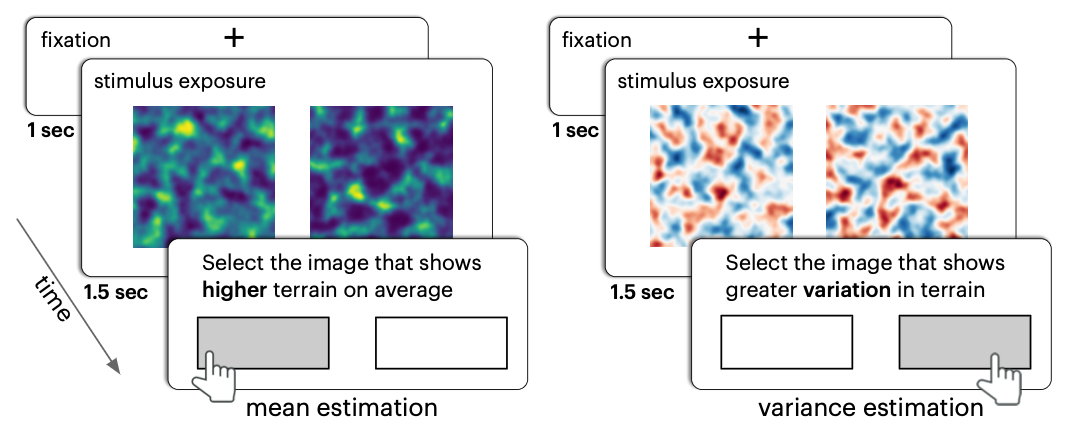
Visualizations support rapid analysis of scientific datasets, allowing viewers to glean aggregate information (e.g., the mean) within split-seconds. While prior research has explored this ability in conventional charts, it is unclear if spatial visualizations used by computational scientists afford a similar ensemble perception capacity. We investigate people's ability to estimate two summary statistics, mean and variance, from pseudocolor scalar fields. In a crowdsourced experiment, we find that participants can reliably characterize both statistics, although variance discrimination requires a much stronger signal. Multi-hue and diverging colormaps outperformed monochromatic, luminance ramps in aiding this extraction. Analysis of qualitative responses suggests that participants often estimate the distribution of hotspots and valleys as visual proxies for data statistics. These findings suggest that people's summary interpretation of spatial datasets is likely driven by the appearance of discrete color segments, rather than assessments of overall luminance. Implicit color segmentation in quantitative displays could thus prove more useful than previously assumed by facilitating quick, gist-level judgments about color-coded visualizations.