Feature Clock: High-Dimensional Effects in Two-Dimensional Plots
Olga Ovcharenko - ETH Zürich, Zürich, Switzerland
Rita Sevastjanova - ETH Zürich, Zürich, Switzerland
Valentina Boeva - ETH Zurich, Zürich, Switzerland
Screen-reader Accessible PDF
Download Supplemental Material
Room: Bayshore VI
2024-10-16T13:06:00ZGMT-0600Change your timezone on the schedule page
2024-10-16T13:06:00Z

Fast forward
Full Video
Keywords
High-dimensional data, nonlinear dimensionality reduction, feature importance, visualization
Abstract
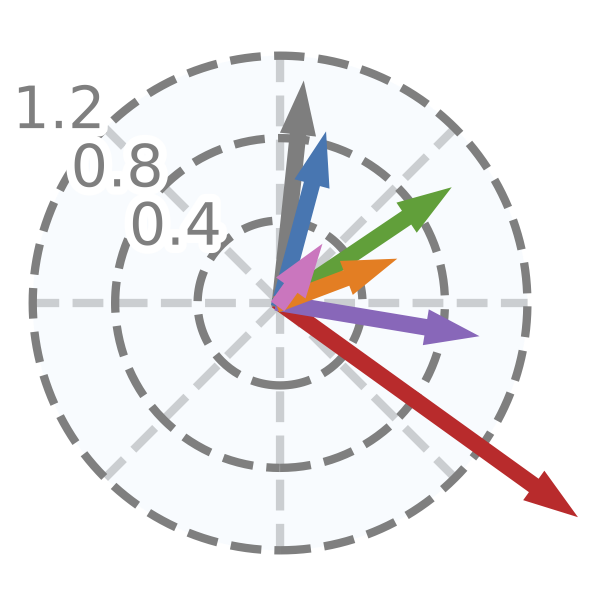
Humans struggle to perceive and interpret high-dimensional data. Therefore, high-dimensional data are often projected into two dimensions for visualization. Many applications benefit from complex nonlinear dimensionality reduction techniques, but the effects of individual high-dimensional features are hard to explain in the two-dimensional space. Most visualization solutions use multiple two-dimensional plots, each showing the effect of one high-dimensional feature in two dimensions; this approach creates a need for a visual inspection of k plots for a k-dimensional input space. Our solution, Feature Clock, provides a novel approach that eliminates the need to inspect these k plots to grasp the influence of original features on the data structure depicted in two dimensions. Feature Clock enhances the explainability and compactness of visualizations of embedded data and is available in an open-source Python library.