Zoomable Level-of-Detail ChartTables for Interpreting Probabilistic Model Outputs for Reactionary Train Delays
Aidan Slingsby - City, University of London, London, United Kingdom
Jonathan Hyde - Risk Solutions, Warrington, United Kingdom
Download preprint PDF
Download Supplemental Material
Room: Bayshore VI
2024-10-17T13:24:00ZGMT-0600Change your timezone on the schedule page
2024-10-17T13:24:00Z

Fast forward
Full Video
Keywords
Level-of-detail, mini-charts, distributions, stochastic modelling.
Abstract
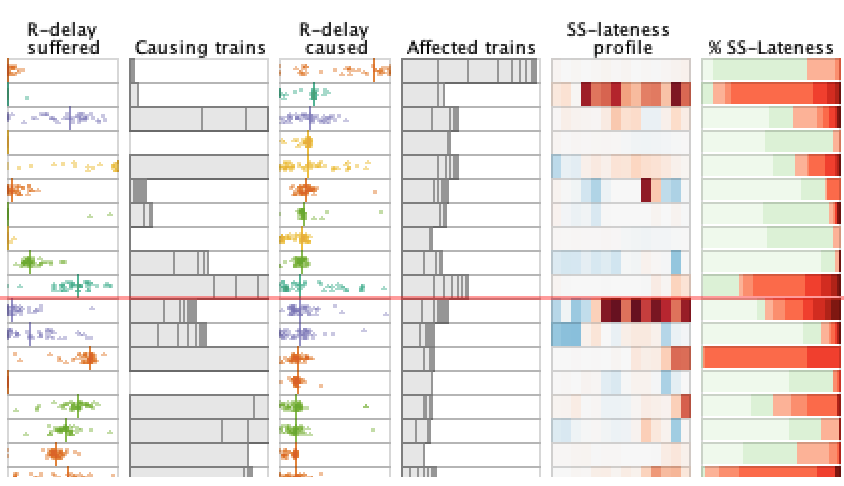
"Reactionary delay" is a result of the accumulated cascading effects of knock-on train delays which is increasing on UK railways due to increasing utilisation of the railway infrastructure. The chaotic nature of its effects on train lateness is notoriously hard to predict. We use a stochastic Monte-Carto-style simulation of reactionary delay that produces whole distributions of likely reactionary delay and delays this causes. We demonstrate how Zoomable Level-of-Detail ChartTables - case-by-variable tables where cases are rows, variables are columns, variables are complex composite metrics that incorporate distributions, and cells contain mini-charts that depict these as different levels of detail through zoom interaction - help interpret whole distributions of model outputs to help understand the causes and effects of reactionary delay, how they inform timetable robustness testing, and how they could be used in other contexts.