Glyph-Based Uncertainty Visualization and Analysis of Time-Varying Vector Field
Timbwaoga A. J. Ouermi - Scientific Computing and Imaging Institute, Salk Lake City, United States
Jixian Li - University of Utah, Salt Lake City, United States
Zachary Morrow - Sandia National Laboratories, Albuquerque, United States
Bart van Bloemen Waanders - Sandia National Laboratories, Albuquerque, United States
Chris R. Johnson - University of Utah, Salt Lake City, United States
Screen-reader Accessible PDF
Download preprint PDF
Room: Bayshore VI
2024-10-14T12:30:00ZGMT-0600Change your timezone on the schedule page
2024-10-14T12:30:00Z

Abstract
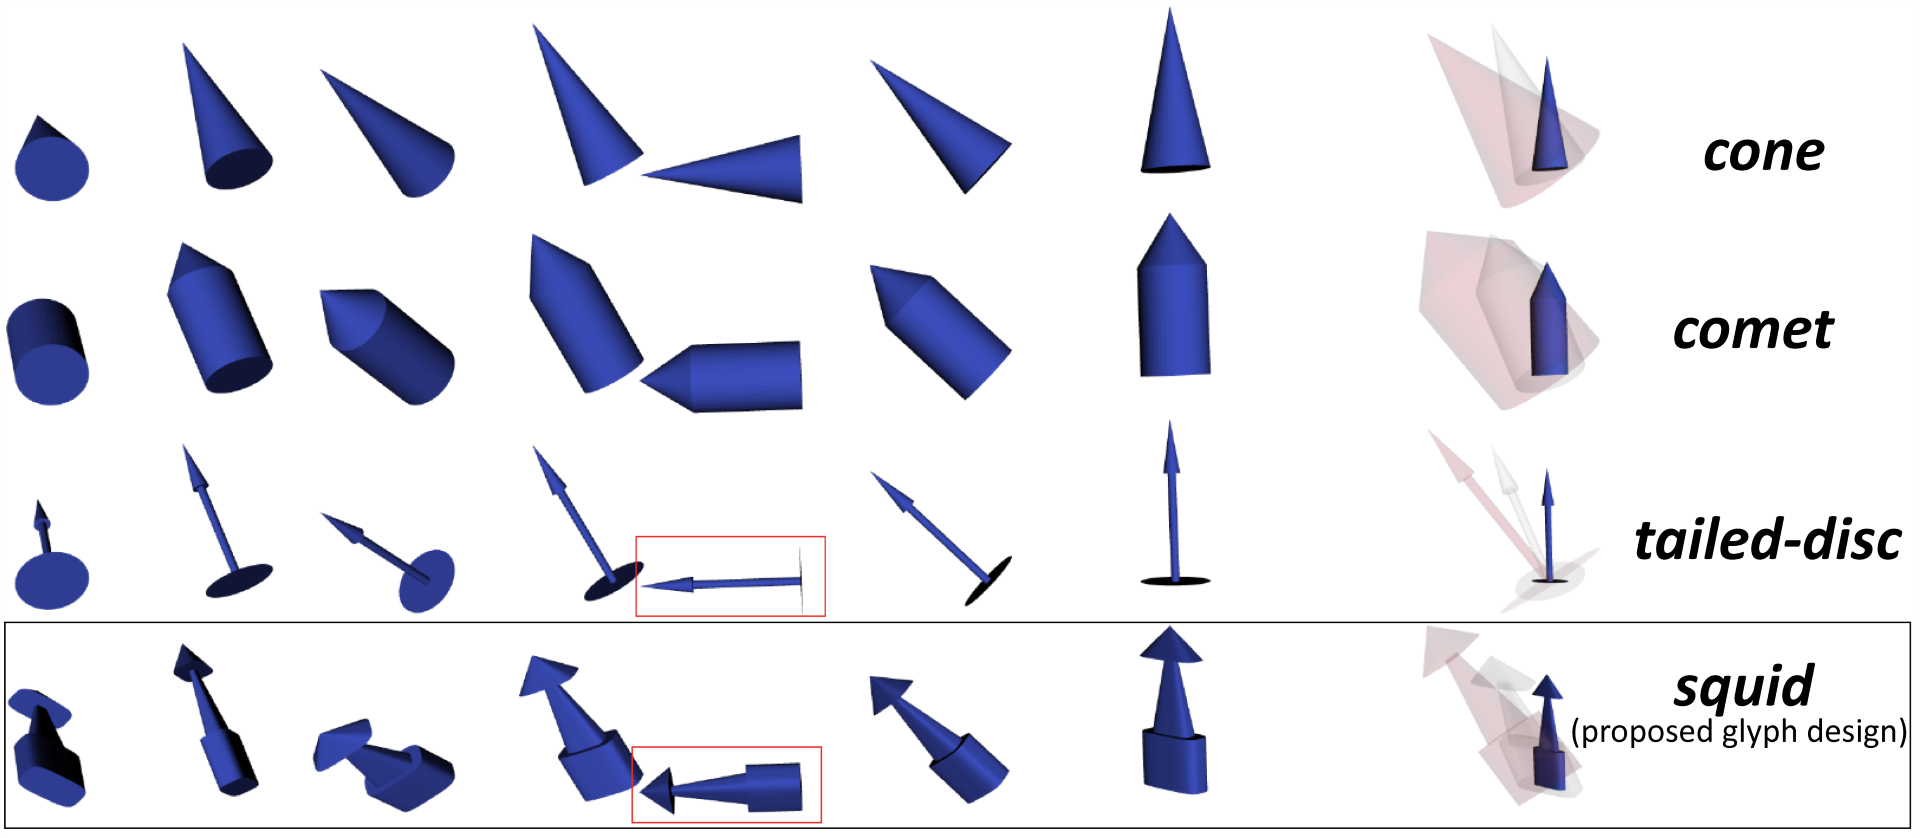
Uncertainty is inherent to most data, including vector field data, yet it is often omitted in visualizations and representations. Effective uncertainty visualization can enhance the understanding and interpretability of vector field data. For instance, in the context of severe weather events such as hurricanes and wildfires, effective uncertainty visualization can provide crucial insights about fire spread or hurricane behavior and aid in resource management and risk mitigation. Glyphs are commonly used for representing vector uncertainty but are often limited to 2D. In this work, we present a glyph-based technique for accurately representing 3D vector uncertainty and a comprehensive framework for visualization, exploration, and analysis using our new glyphs. We employ hurricane and wildfire examples to demonstrate the efficacy of our glyph design and visualization tool in conveying vector field uncertainty.